Best of CH 2014: Data Visualization
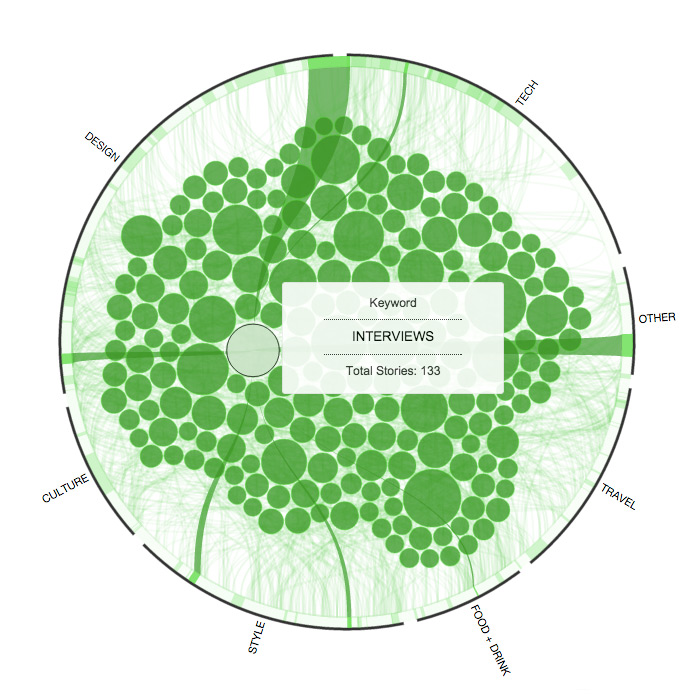
An interactive data graphic explores how our content connected last year across categories and keywords
Find all stories on Quantified in this tag archive.
An interactive data graphic explores how our content connected last year across categories and keywords