Jonathan Corum: For Your Information
A Ken Burns iPad app, touchscreen subway maps, swapping sexism and more in our weekly look at the web
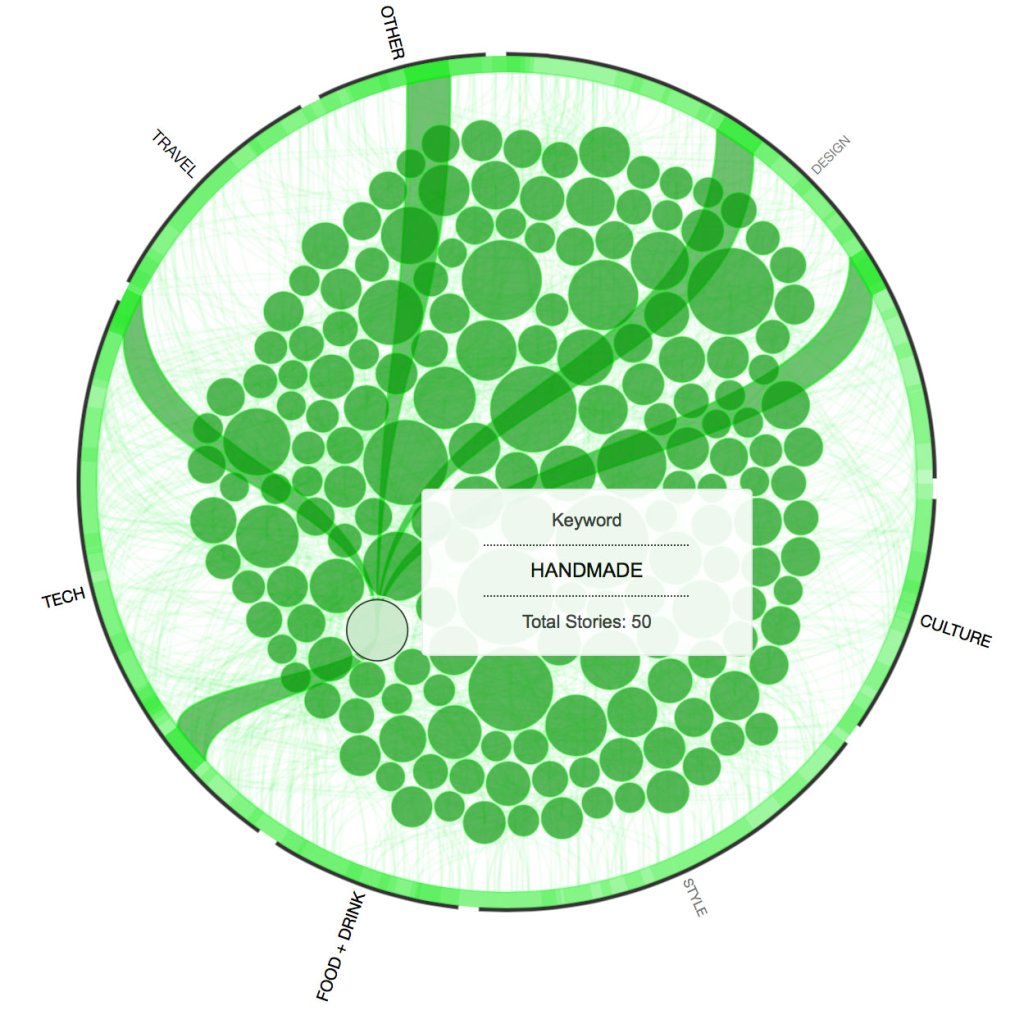
Gestalten digs into the work of the NY Times’ Science Graphics Editor, Jonathan Corum, who outlines his process for creating the newspaper’s highly regarded interactive graphics. Corum explains his main mission is to seamlessly integrate words with art, and to translate very detailed data into a medium that can be easily understood by all. Whether referred to as data visualization or infographics, the core of Corum’s work is actually just lucid storytelling.
COOL HUNTING always gets permission to use the images we publish; however, as an independent publication, we cannot afford to continue fighting unfair claims of copyright infringement, so the images have been removed from this post.
Via news.gestalten.com link opens in a new window